e-commerce-forecasting
E-Commerce Value Prediction and Forecasting
This project is maintained by francisfjin
E-Commerce: Value Prediction and Time-Series Forecasting
By Francis Jin

Problem
This project conducts Value Prediction and time-series forecasting on e-commerce data to analyze trends in revenue and marketing funnel effectiveness for a large-scale online retailer.
Specifically trying to answer the questions:
- Can we detect any patterns in revenue sources either by seller, product type, or location?
- What factors from our marketing funnel have the biggest impact on a seller’s revenue?
- Can we use these features to accurately predict revenue given time-series data?
Data
The two datasets are provided by Olist, the largest department store retailer in Brazilian marketplaces. They generously published on Kaggle.
E-commerce dataset
The e-commerce dataset is real and anonymized commercial data containing over 100,000 orders executed on Olist’s site from 2016 to 2018. Features include: order status, price, payment, delivery, freight performance, customer location, product attributes, reviews, and seller geolocation data.
Marketing dataset
The marketing dataset is from the marketing funnel of sellers that filled-in requests to sell products on Olist. The dataset has information on 8,000 marketing qualified leads from 2017 to 2018, as well as features describing the deals that were closed. Features include: lead type, lead behavior profile, lead category, catalog size, business type, average stock, sales representative, date the deal was closed, origin of the lead.
Data Importing and Joining
We import all relevant CSVs and join as per the data mappings.
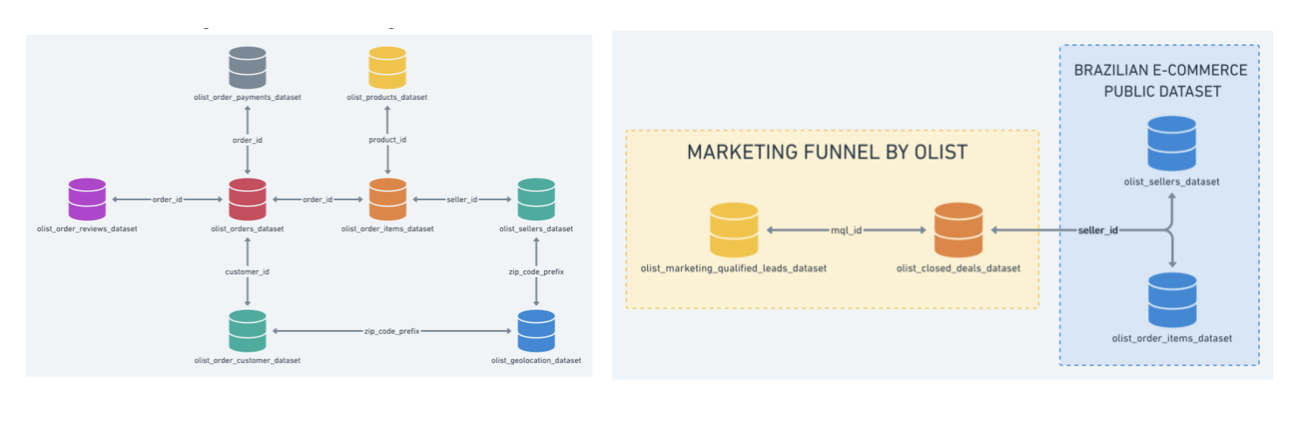
Target Variable is ‘price’ column which is the price the customer paid for each order. This represents the gross sales number for each order. We rename this column ‘revenue’.
Datetime conversions are performed to generate additional ‘closing_days’ feature from the marketing dataset, representing the number of days it took to sign a seller from first date of contact.
We drop heuristically irrelevant columns to filter for just the features we want and our target.
Null values for categorical features are filled with ‘other’ category, some predictive power might be lost here due to this noise.
Exploratory Data Analysis (EDA)
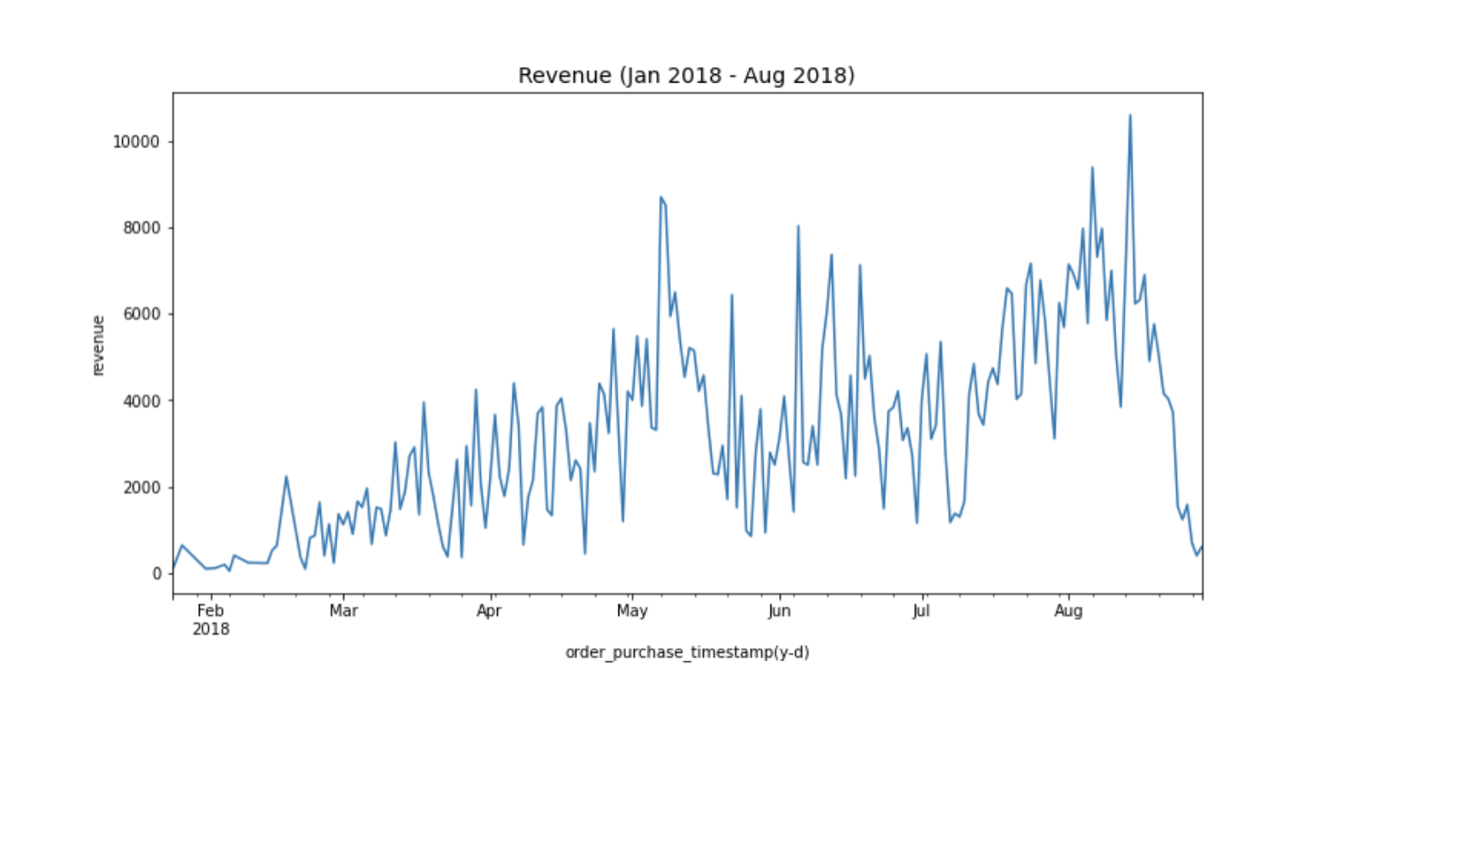
Time-Series
Time-series data is generated to view total revenue over the time period available, rounded to units in days.
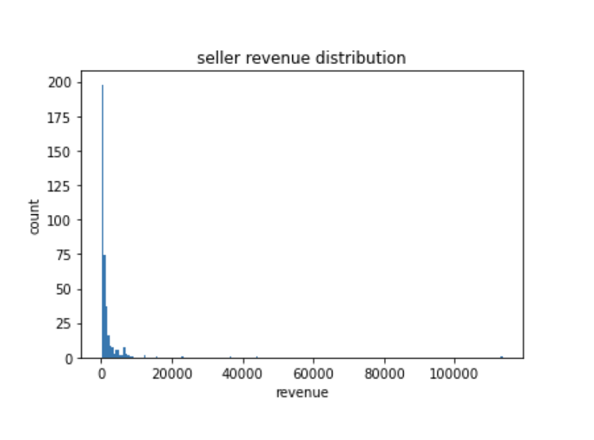
Sellers
Grouping by seller_id, we investigate the distribution of revenue per seller. As seen, most sellers generate a small amount of revenue while there are a few big generators and one top seller that is definitely an outlier.
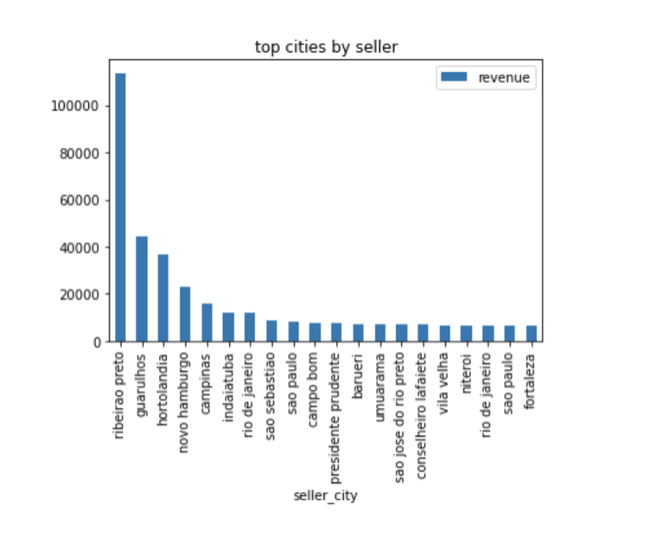
Location
Grouping by location, we investigate the distribution of revenue per city. We see that a few cities account for the bulk of the revenue.
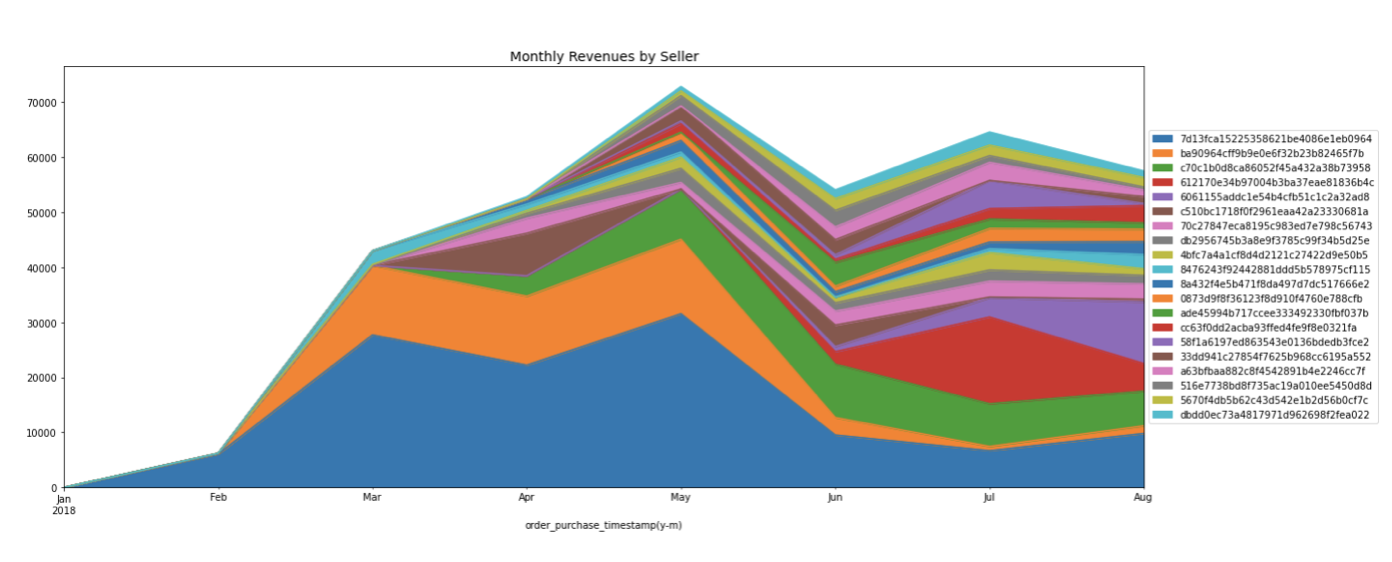
Monthly Revenue by Seller
Grouping by the top 20 sellers and plotting over time, we see the graphs of monthly revenues by seller.
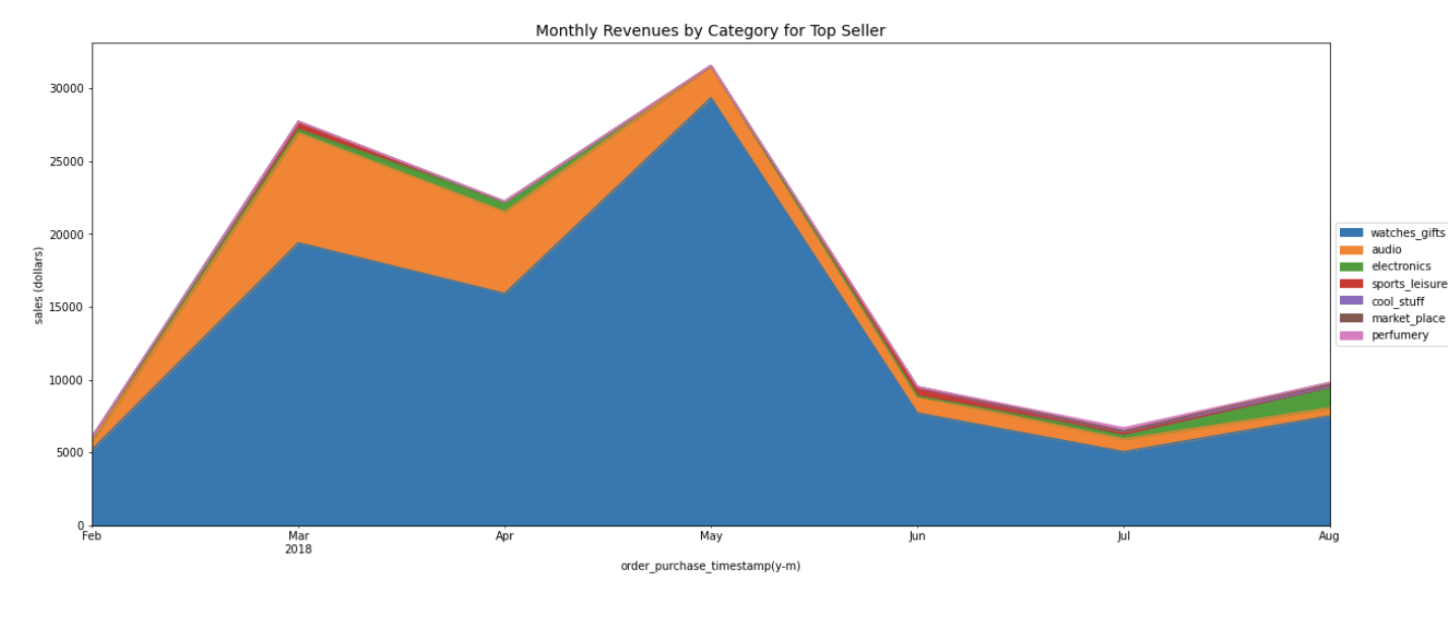
Top Seller
Filtering for the top seller, we split revenue by product group to see which ones are generating the most revenue. The ‘watches_gifts’ category actually generated 79.3% of total revenue for seller. Revenue shows traits of seasonality as it increased in March and peaked in May.
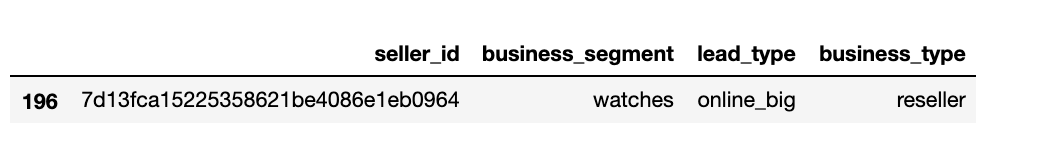
The top seller on Olist accounts for 16.7% of total revenue.

The top seller on Olist, accounting for 16.7% of total revenue for the time period, is an ‘online_big’ and ‘reseller’. This indicates that most likely it is a internet-based company with command of market share. These characteristics can heuristically inform future marketing decisions when deciding which types of sellers to target for Olist.
Feature Engineering and Selection
We use one-hot encoding as well as label encoding to convert categorical features, depending on how many classes the feature has and whether it is ordinal or just cardinal. Then we use mutual information regression feature selection from Sklearn to generate feature importances.
‘Lead-type’ has the highest correlation with the target variable ‘revenue’, making it the most important feature. This qualitatively makes sense given that this feature is what tells you what size and type of retailer the seller is (online_medium, online_big, online_small, industry, offline_beginner, offline, online_top).
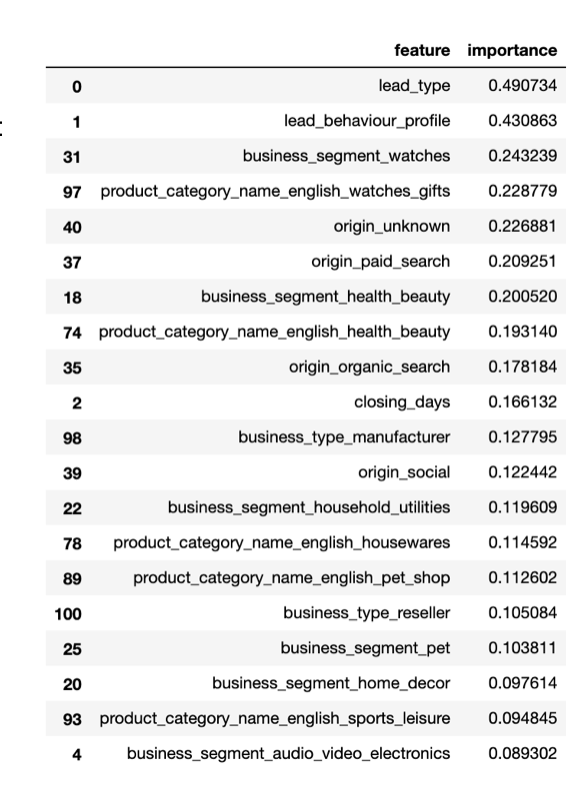
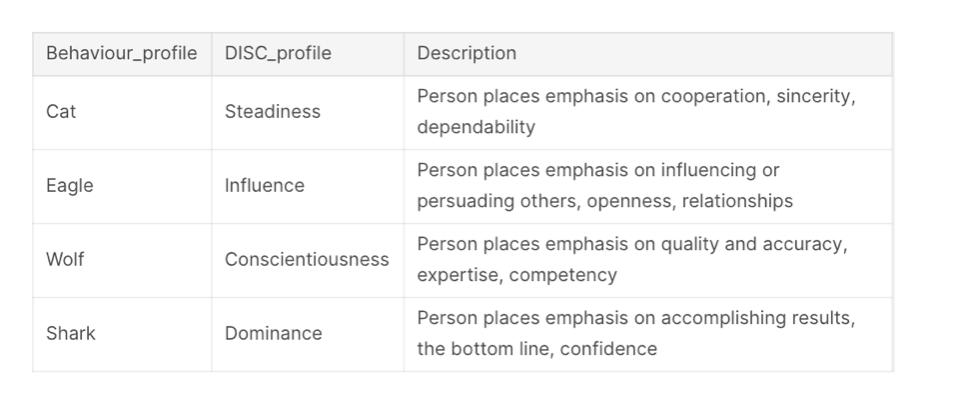
Interestingly, the second most important feature is ‘lead_behaviour_profile’, from the DISC personality test. The sales representative identifies this on contact with the seller.
This confirms the hypothesis not only that the marketing funnel for leads for sellers can help predict revenue, but also which types of leads are best to target to maximize future revenue.
Linear Regression
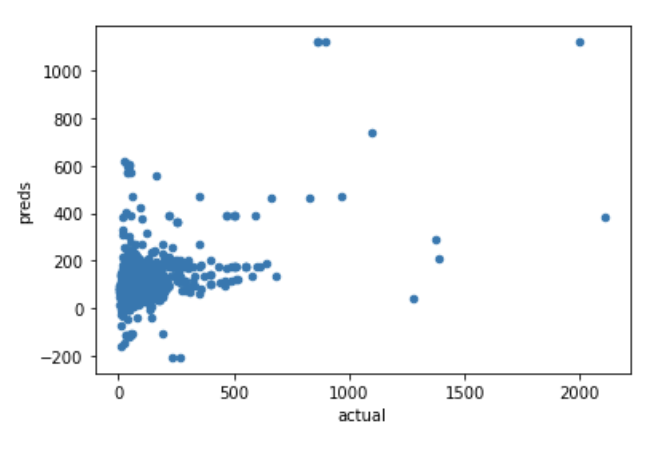
A Ridge regression model is ran because of the large number of features in the dataset, using L2 regularization which adds the squared magnitude of coefficients as penalty term to the loss function. The data is scaled before fitting using a RobustScaler given the presence of outliers.
The result on the test set is a low R-squared score ~.25 which means low predictive power in linear space.
Time-Series Forecasting
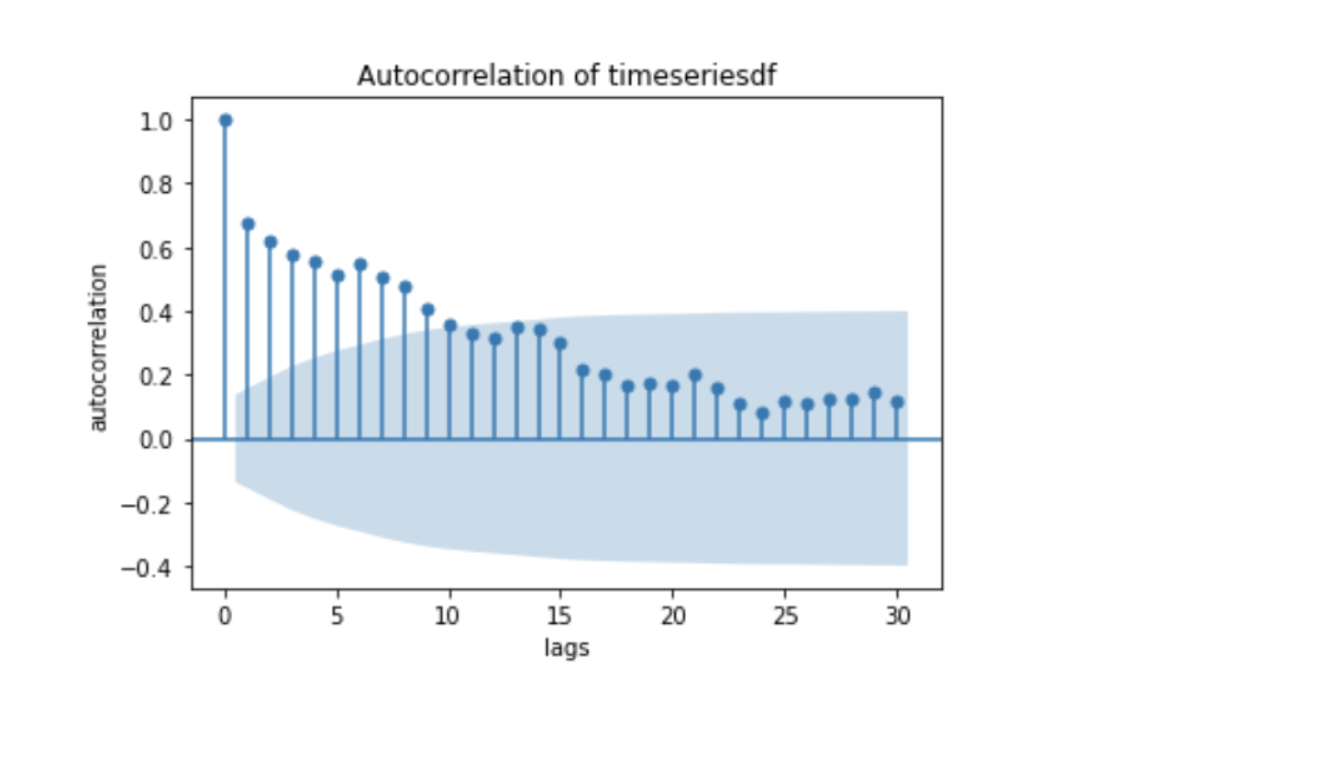
The time-series revenue data is split into training and test sets. First, we investigate autocorrelation in the dataset to see if periods of data are correlated with other periods. We see that the spikes are statistically significant for lags up to 8 time periods (in this case, number of days).
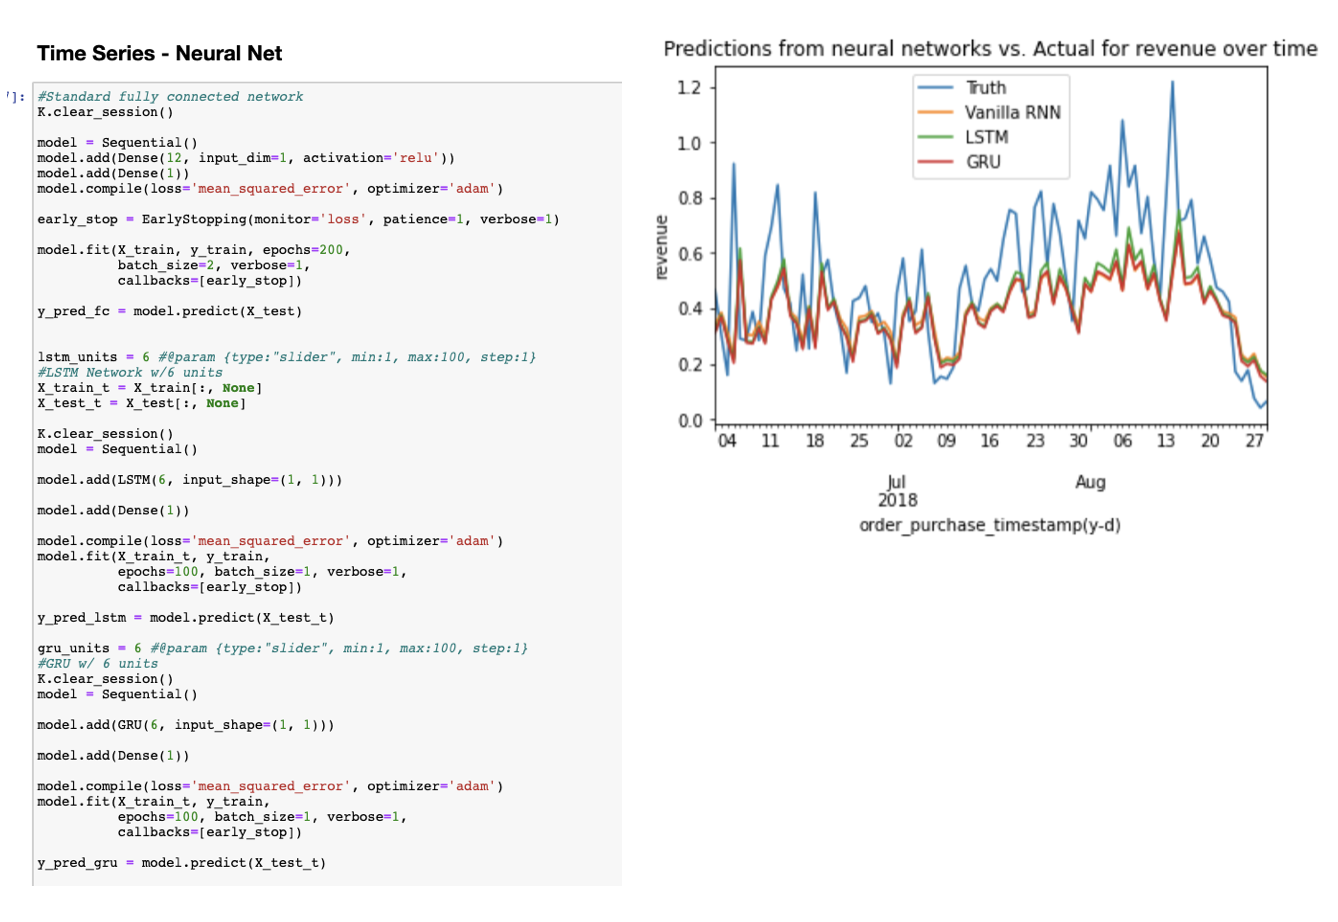
MinMax scaling is performed and fed into the following neural networks for comparison: Vanilla Recurrent NN, LSTM, GRU. Overall, the model seems to underestimate the peaks but generally does a good job of predicting revenue!
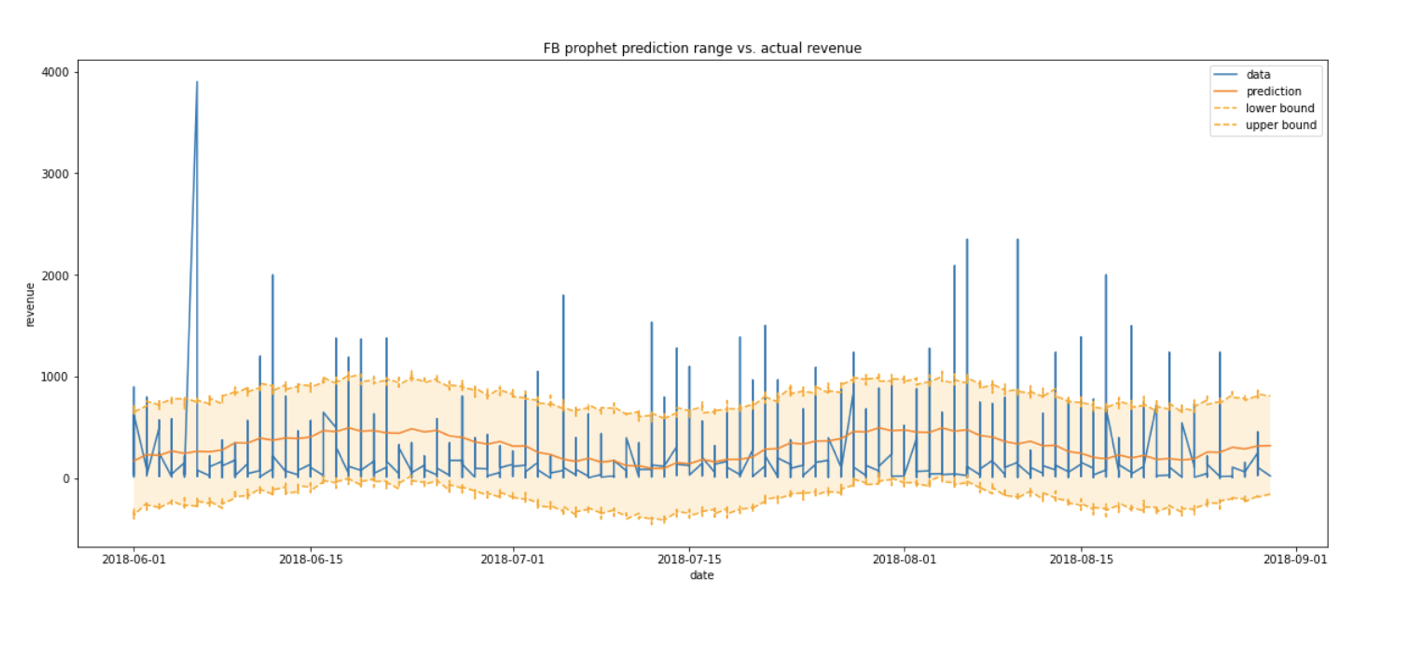
The time series data is then fit with the Facebook Prophet procedure for time-series forecasting, which as you can see from results requires additional tuning. It is based on an additive model where non-linear trends are fit with yearly, weekly, and daily seasonality, plus holiday effects
Conclusions
Given our insights from Exploratory Data Analysis, Feature Selection, as well as Regression and Time-series Forecasting, we have gained the following valuable pieces of information.
- Most sellers generate a modest amount of revenue, with one big outlier who is an online re-seller accounting for 16.7% of total revenue.
- The top cities for revenue were Ribeirao Preto, Guarulhos, and Hortolandia.
- The most important factors for revenue for sellers is lead_type, and lead_behaviour_profile, which originate from the marketing funnel, these profiles should be targeted in marketing strategy.
- Revenue is seasonal, and can be predicted to a reasonable degree with neural networks.
With these results, Olist can inform future marketing decisions and strategies by targeting certain locations, products, and profiles of sellers to maximize revenue based on the seller leads’ characteristics. Also, using time-series forecasting with neural networks, the company can create predictions for future revenue based on seasonality trends.